

As data scientists, you’ll often face datasets too large to understand. With the recent advances in machine learning, we can visualize nearly any variable, parse massive amounts of text into understandable pieces and find hidden trends within our datasets.
After this 6-minute read, you’ll fully understand summarization in data mining, how this can help you with your variables, and be fully equipped with a python solution that will work for any amount of text or data.
What is the meaning of summarization?
Summarization is simple; it’s extracting the most meaningful information from some medium and re-displaying it in a fashion that is easy to understand. Summarization can be applied to many mediums and isn’t only focused on statistical analysis.
Things that can be summarized
- Blogs
- Movies
- Books
- Stories
- Experiences
- Memories
- Datasets
- Variables in Datasets
- Text Data
As we can see, there are more applications for summarization than just utilizing it in data mining.
Some of these you probably do every day when you’re telling a story or trying to remember something.

What is Data Summarization in Data Mining?
Data Mining or Knowledge Discovery In Data (KDD) is a technique that extracts patterns and information from large data sets.
As technology advances and the size of data increases, utilizing state-of-the-art data mining techniques is helping enterprises transform raw data into valuable information.
Although these technologies can process large quantities of data, they face scalability and automation challenges.
While this article primarily covers data summarization and data mining, we will review some issues that could help you scale your solutions as a data scientist.
What is the purpose of data mining?
Data Mining is focused on the extraction of data from vast datasets. This involves extracting information through statistical analysis and mining, and this is all done through recent computing advances.
During the extraction process, the data is examined to find patterns, identify correlations, and uncover anomalies.
It can help you improve business processes and stop certain practices from preventing growth.
Data Mining begins by identifying business objectives from extracted data and then collecting information.
![]()
What are some summarization techniques for numerical data visualization?
-
Histograms/Frequency Histogram
- Bucket Representations
- Width is a Uniform Size
- Bucket Represented by a Rectangle
-
Quantile Quantile Plot (QQ Plot)
- Compare two sets of data to compare their underlying probability distribution.
- If the two data sets have the same underlying distribution, there will be a straight line on the QQ plot.
- See if data has shifts or tails.
-
Scatter Plot
- Determines the patterns or trends between two numerical columns.
- Great for showing a positive or negative correlation between two attributes
-
Loess Curve (local regression)
- Nonparametric uses weighted regression to fit a smooth curve. Useful to find trends and seasonality in data.
- Alpha, a smoothing parameter, has values [.5, 1]. As alpha increases, the curve is smooth
- Lambda is a degree of polynomials fitted by the regression.
-
Box Plot
- Useful as an indicator of how the values in the data are spread out
- Summarizing data on an interval scale.
- Usually used in explanatory data analysis for distribution, central value, and variability.
What are some techniques for text summarization in data mining?
-
TF-IDF (Term frequency-inverse document frequency)
- TF-IDF for certain words increases as that word is used in a document.
- Offset by how many different documents the words belongs to.
-
LexRank
- Similar to TextRank, a graph is constructed for each sentence in the document, creating a vertex for each.
- The edges and overlappings of the graph will be similar sentences.
- After applying the PageRank Algorithm, summaries are formed by combining top-ranking sentences.
-
LTSM (Long short-term memory)
- Artificial neural network
- Need labeled data to train the network
- Most cited neural network, shown improvements over RNN
-
GPT-3
- We do not need to train this model in the traditional way.
- It has costs that scale with prompt size.
- Prompt Optimization has shown incredible insights.
- API structure means needs to be connected to the internet to use.
Performing data summarization on numerical data in Python
Below, we code up all the data summarization techniques we discussed earlier.
We will also explain when and why you would use these data mining techniques.
This is key for extracting meaningful information from your large datasets in Python.
Building Histograms/Frequency Histograms in Python
# imports
import numpy as np
import pandas as pd
import matplotlib.pyplot as plt

# pull in some random numerical data
df = pd.read_csv('ds_salaries.csv')

# lets say we are working with salary
df.salary.hist(bins=5)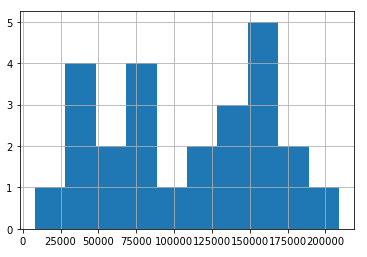
When should you use Histograms/Frequency Histograms in data mining?
Histograms are great for a quick summarization of your raw data.
Due to the bucketing nature of histograms, general trends are easily identifiable, but identifying things like distributions and outliers is tough.
In every data science project, I start by building histograms for all of my numerical columns.
Building a Quantile Quantile Plot (QQ Plot) in Python
import numpy as np
import pandas as pd
import scipy.stats as stats
import matplotlib.pyplot as plt

# pull in some random data
df = pd.read_csv('ds_salaries.csv')

# lets work with salary
df = np.log(df[['salary']])

# use scipy.stats to plot against a norm
stats.probplot(df['salary'], dist=stats.uniform, plot=plt)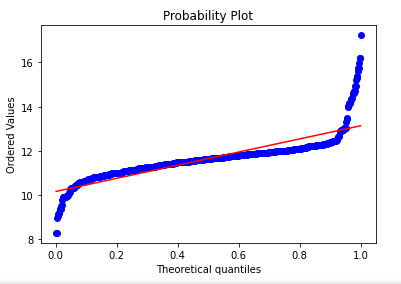
When should you use the Quantile Quantile Plot (QQ Plot) in data mining?
One of my favorite uses of the QQ plot is to check if a numerical column is normally distributed.
Some machine learning models (like tree-based models) do not need normality, but other models do.
QQ Plots also come in handy after you’ve built your model. One check that I like to do after I’ve built a model is to plot the residuals.
A regression model residuals should be normal, and if they’re not, we can draw insights from our QQ plot to see where the deviance is.
Building a Scatter Plot in Python
import numpy as np
import pandas as pd
import scipy.stats as stats
import matplotlib.pyplot as plt

# pull in some random data
df = pd.read_csv('ds_salaries.csv')

# lets work with salary
df = np.log(df[['salary', 'salary_in_usd']])

# plt our scatter plot
plt.scatter(df['salary'], df['salary_in_usd'])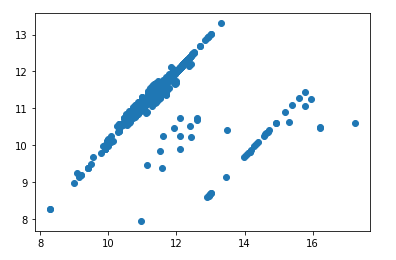
When should you use a Scatter Plot in data mining?
Scatter plots come up over and over again in data mining.
My favorite use of the Scatter Plot is to check for heteroskedasticity.
Heteroskedasticity is nearly impossible to see just from the numbers, but it’s easy to see when plotted with a scatter plot (like below).
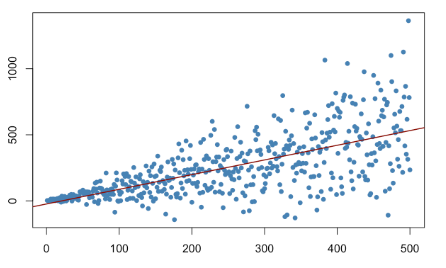
We can see that over time our variable does not have equal variance. The values spread out into a cone shape as we progress in time.
Even though our model fit looks good, heteroskedasticity is a nightmare for some models, like OLS.
As a tip, usually normalizing your data will take care of heteroskedasticity.
One of my favorite ways to do this is with np.log or a box-cox transformation.
Building a Loess Curve (local regression) in Python
import numpy as np
import pylab
import seaborn as sns
import statsmodels.api as sm

sns.set_style("darkgrid")
pylab.rc("figure", figsize=(16, 8))
pylab.rc("font", size=20)

# use our salary data again
x = [val for val in range(0,len(df['salary']))]
y = np.log(df.salary)

# Compute a lowess smoothing of the data
smoothed = sm.nonparametric.lowess(exog=x, endog=y, frac=0.1)

# Plot the fit line
fig, ax = pylab.subplots()
ax.scatter(x, y)
ax.plot(smoothed[:, 0], smoothed[:, 1], c="k")

# peak our values
pylab.autoscale(enable=True, axis="x", tight=True)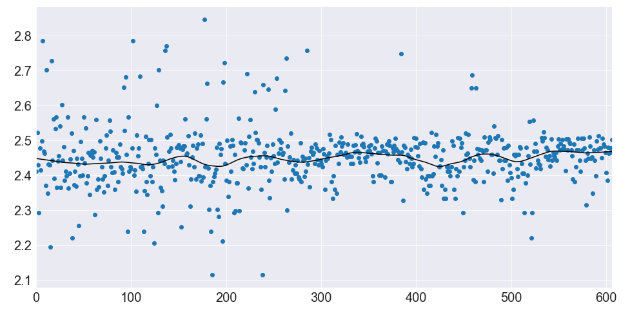
When should you use a LOESS Curve in data mining?
The LOESS curve is great for visualizing patterns in your data.
While I don’t use the LOESS curve much, it does have a place in noisy data.
Building a Box Plot in Python
# Imports
import matplotlib.pyplot as plt
import pandas as pd
import numpy as np

# Creating plot
plt.boxplot(df['salary'])

# show plot
plt.show()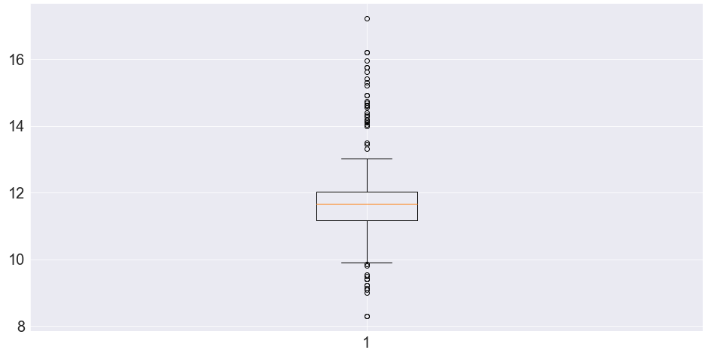
When should you use a Box Plot in data mining?
One of the best uses of the Box Plot is comparing variables and checking for outliers.
When you have a numerical column, your box plot will help split up your data.
As we can see above, our salary data is heavily spread out, and many of our values are stuck in the 25th and 75th percentiles.
As a data scientist, you’ll want to investigate why the data has such a massive spread.
You’ll also want to use some type of transformation to help squeeze that data back into an acceptable range.
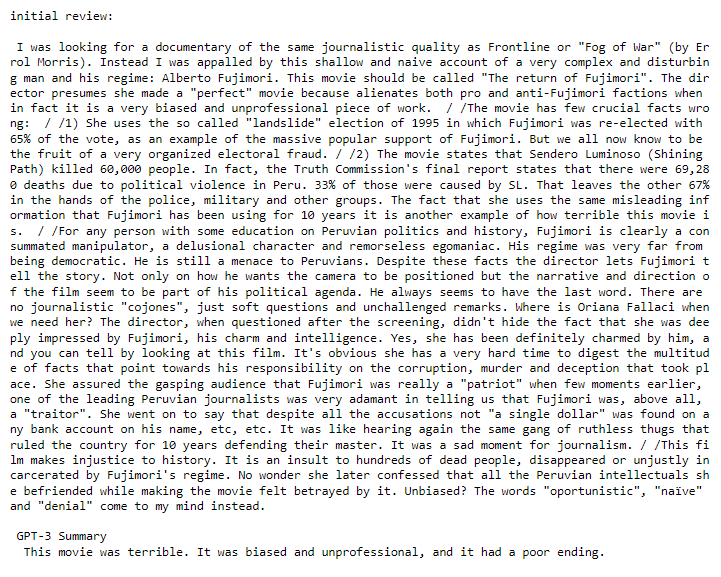
Performing data summarization on text data in Python using GPT-3
For this, we will take some reviews that are quite long and see how GPT-3 does at summarizing them for us.
We will utilize a very simple prompt optimization to get GPT-3 to give us our desired results
df_text = pd.read_csv('imbd_train_dataset.csv')

text_data= [val.replace('br','')\
             .replace('<',"")\
             .replace(">","")\
             .replace('\\',"")\
             .replace('\/',"") for val in df_text['text'].sample(n=3)]

text_data
We can see how long each of these reviews is below.
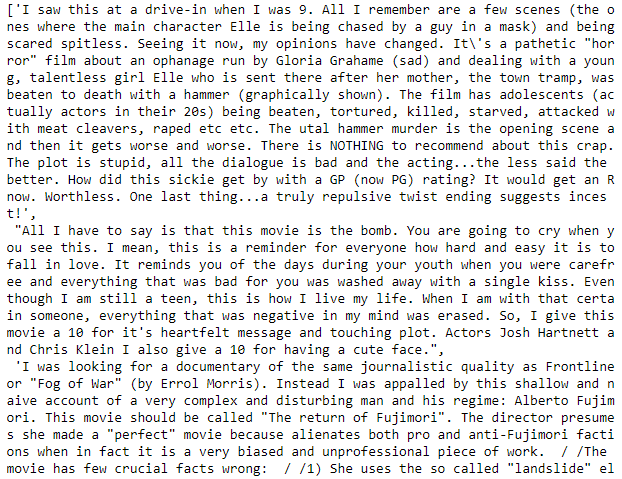
To handle this task, we build a simple loop and send our reviews through GPT-3
import os
import openai
import time

# put your openAI key here
openai.api_key = my_key

# store reviews
reviews = []

# loop through our reviews
for val in text_data:

    # we do a simple prompt optimization here
    p = f'''
          Review: This movie really sucked.....HARD! It was just stupid with a terrible ending. I love a really cheesy horror flick, but this was terrible! The "trick" ending totally contradicts everything you\'ve seen in the movie, if you last til the end. Take my advice and steer clear of that dirty old hag The Granny.
          Summary: Bad Movie with a poor ending
          Review: {val}
          Summary:
          '''

        # generate the response
    response = openai.Completion.create(
          engine="davinci-instruct-beta-v3",
          prompt=p,
          temperature=0.7,
          max_tokens=500,
          top_p=1,
          frequency_penalty=0,
          presence_penalty=0,
          stop=["3."]
        )

        # grab our text from the repsonse
    text = response['choices'][0]['text']

    reviews.append(text)
Notice above with every call of GPT-3, we first send GPT-3 an example review and summary. This quickly allows GPT-3 to get an idea of the type of summary we want.
With each pass of the loop, we send the Review, then leave the Summary blank for GPT-3 to fill in for us
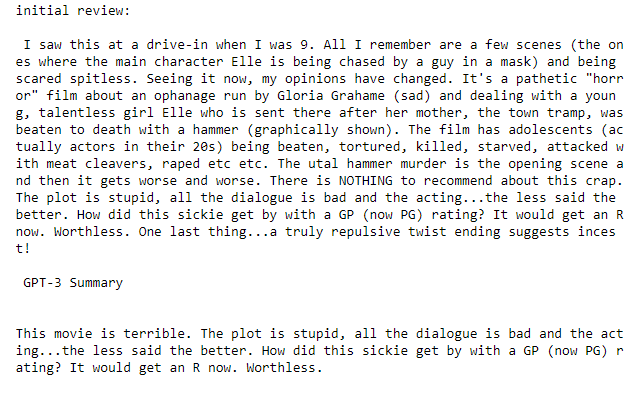
Let’s see how GPT-3 does
for i in range(0,len(reviews)):
    print(f'''initial review {text_data[i]} \n\n GPT-3 Summary {reviews[i]}\n\n''')
Review 1:
Review 2:

Review 3:
While we could continue optimizing our prompt, as seen above, we can get accurate summaries even with a simple prompt.
Does data mining work on any type of generated data?
Data mining techniques will work with any type of data. However, the assumption in data mining is that your independent variables and dependent variables are related. If they are not related, data mining methods will not be able to find hidden information and trends since they do not exist.
In data science, we make the assumption that the predictor variables can explain some percentage of the variance.
While in most datasets, this is true, there are times when datasets cannot explain enough of the variance to make any insights.
If this happens, you’ll need to revamp your data collection process and try to find a dataset that can explain large amounts of variance.
