Even though clustering is a cornerstone of data science and data mining, many falsely assume that clustering does not come without its challenges.
In this 9-minute read, we will go over the challenges of clustering, what clustering is, the different clustering algorithms you can use to solve your problems, and some real-life examples of where clustering has been used before.

What are the major issues in clustering?
- The cluster membership may change over time due to dynamic shifts in data.
- Handling outliers is difficult in cluster analysis.
- Clustering struggles with high-dimensional datasets.
- Multiple correct answers for the same problem.
- Evaluating a solution’s correctness is problematic.
- Clustering computation can become complex and expensive.
- Assumption of equal feature variance in distance measures.
- Struggle with missing data (columns and points)
Below, we break down each one of these in full detail.
While these challenges to clustering data are real and valid, there are ways to handle them that will lessen their impact on your analysis.
Clustering Challenges from Data Changing
Clustering struggles with time series data since you will have to pick a point in time to do your analysis. Data points could have belonged to any number of clusters at any time, and doing one analysis at one point in time may be misleading.
This is easiest to see with an example.
Let’s say you have a product order database. Your team wants you to discover hidden relationships between customers who ordered your product last month.
Immediately, you jump into your database, pull all customers who ordered last month and run your K-means algorithm on them to get your clusters.
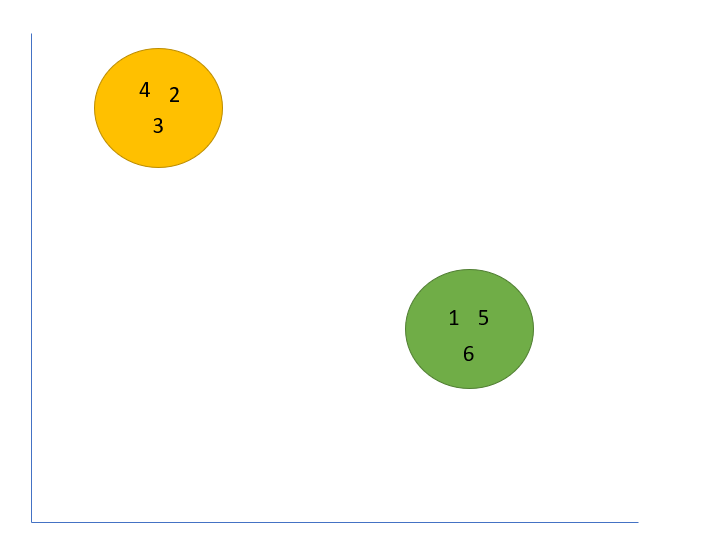
Your clusters look like this below (where each data point is a customer ID):
Initially, you start to celebrate. You’ve found clear-cut clustering results that have great separation.
However, your manager wants you to redo the analysis for this month, just in case.
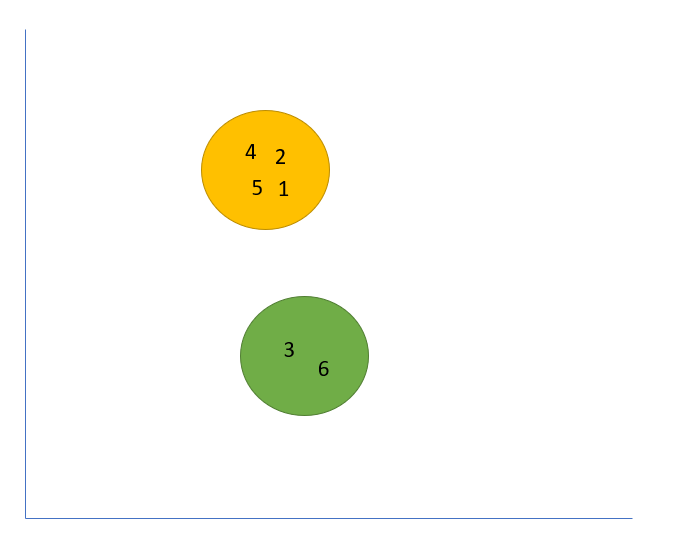
Your clusters now look like this below:
Wait, what happened?
Right away we see a huge difference. CustomerID one and five no longer belong to the green clusters, and our groups are much closer in our subspace.
Which one is right? The one from last month or the one from this month?
The answer is both, which diminishes our ability to gain insights and differentiate data points (customers) that are changing behavior over time.
Clustering Challenges from Outliers
Since most clustering algorithms use distance-based metrics, outliers in our datasets can completely change the clustering solution. The presence of just one outlier will cause cluster centroids to update, possibly moving points that should exist in one cluster to another.
Again, this is easiest to see with an example.
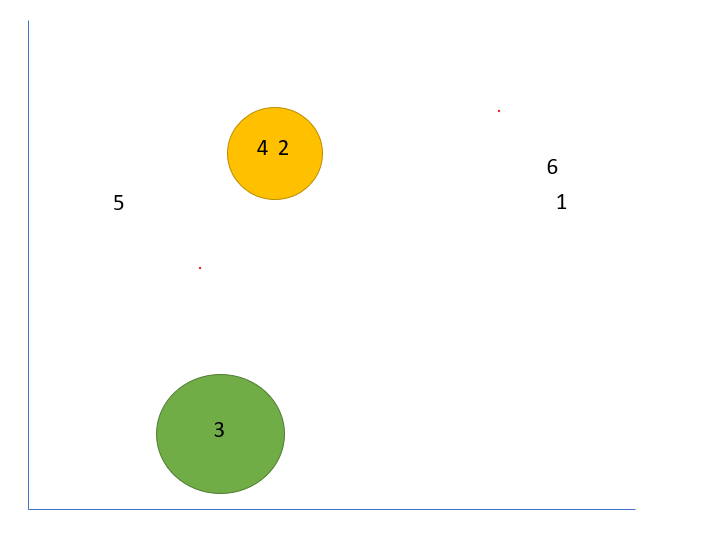
In the below image, what clusters do you think customerIDs five, six, and one should belong to?
Let’s run K-means and find out.
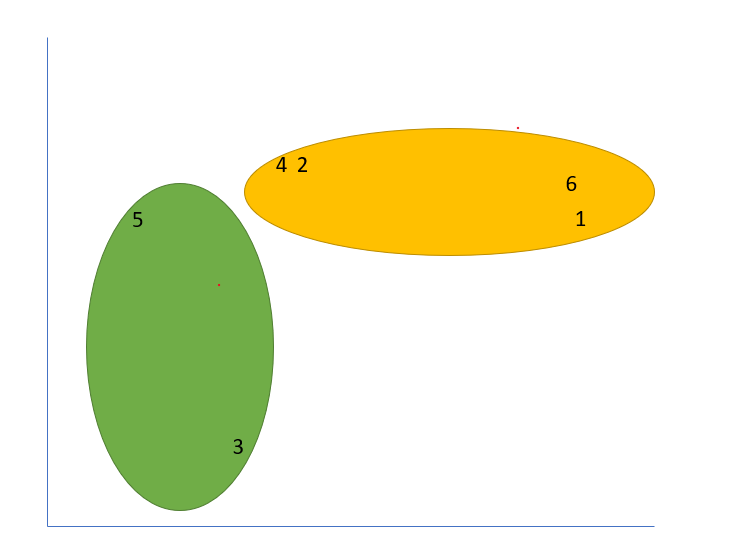
In one solution, due to randomly selected points, we arrive at this solution:
As a data scientist, is there any value in these clusters?
There may be some, but these clusters have low informational output and do not accurately represent clusters within our data.
Clustering Challenges from high dimensional data.
High-dimensional data affects many machine learning algorithms, and clustering is no different. Clustering high-dimensional data has many challenges. These include the distance between points converging, the output becoming impossible to visualize, correlation skewing the location of the points, and the local feature relevance problem.
The curse of dimensionality will come up repeatedly in data science.
While you could write a course on this topic, in simple terms, your dataset becomes sparse as the volume of your subspace increases (from many variables).
To make up for this, the amount of data needed grows exponentially to gain an accurate result from your algorithm, usually past the amount available or computationally feasible.

A famous research paper released in 2002 goes over this problem in-depth for clustering algorithms.
They found that one way to deal with the problem of high dimensional space in clustering applications is to use the manhattan distance (L1 norm) compared to euclidean (L2 norm).
Another famous way to deal with this problem is principal component analysis. This will reduce the dimensions in your subspace.
However, this comes with tradeoffs. We will lose variance (explainability) to bring down our dimensions.
Clustering challenges from multiple solutions.
Many clustering algorithms will generate random centroids to start the computation. This methodology creates a scenario where different solutions can be found depending on how many clusters are chosen and where the centroids are initially placed. Since many local solutions can be found, the reproducibility of your analysis suffers.
When there are many points, an optimal solution usually exists. This allows our algorithm to find it, regardless of where the starting points are picked.
In some cases, no optimal solution exists, and your algorithm can return many different local solutions depending on where the initial centroids were placed.

Clustering challenges in evaluating accurate solutions
Since labeled data is missing in clustering algorithms, evaluating solutions becomes tough. This is because we have nothing to compare our clusters against. There are tactics to evaluate solutions from clusters (like the silhouette method), but utilizing distance in our metrics can cause problems.
A famous way to investigate your clusters is by utilizing the silhouette method. While this method provides insights, we do fall into some of the same problems above using distance metrics.
Clustering challenges due to computation limits.
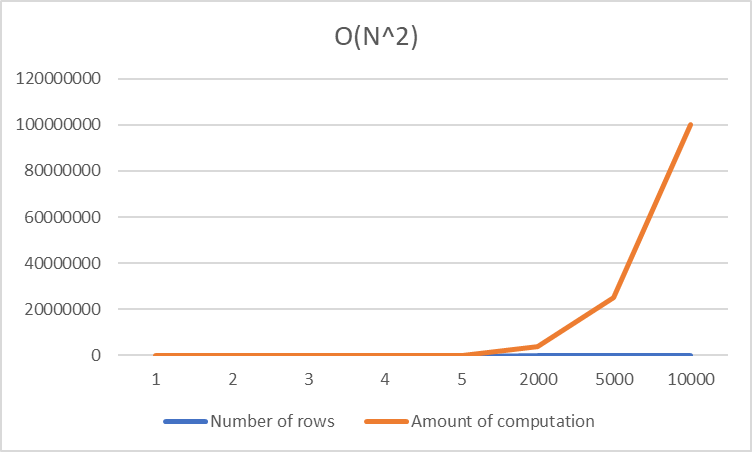
In situations where there are very large data sets or many dimensions, many clustering algorithms will fail to converge or come to a solution. For example, the time complexity of the K-means algorithm is O(N^2), making it impossible to use as the number of rows (N) grows.
It doesn’t matter if you’re doing machine learning or leet code; in computer science, you want to try your best to avoid situations where the time complexity is O(N^2).
Here is a quick visual showing how the computation skyrockets as N increases.
As you can see above, the computation cost is still low when our N value is small.
But as N increases past 10,000 – our computation skyrockets.
While 10,000 seems like a big number – in data science, it’s relatively small.
It’s not uncommon to see datasets in the billions and millions, making these suboptimal algorithms expensive.
Clustering challenges based on initial clustering assumptions.
Clustering algorithms that only utilize distance metrics assume that all features are equal in terms of relevance to the problem. This creates problems, as some dimensions are much more relevant to our specific situation than others, potentially weakening our analysis.
This one is hard to visualize, so we will use a simple example.
CustomerID Time-In-Store Money-Spent Shoe Size 1 8 Minutes $ 383.00 7 2 4 Minutes $ 888.00 11 3 0 Minutes $ 92.00 5 4 10 Minutes $ 288.00 9 5 3 Minutes $ 636.00 9 6 6 Minutes $ 528.00 6 7 10 Minutes $ 162.00 9 8 3 Minutes $ 117.00 6 9 14 Minutes $ 847.00 9 10 9 Minutes $ 609.00 8
Your manager has asked you to find out if any hidden groups or relations within this dataset are relevant to increasing sales at a local retail store.
Shoe Size would be as influential (equal variance) in distance-based clustering as Time-In-Store and Money-Spent.

Right away, that makes no sense and should probably be thrown out.
Real-life problems will not be as obvious, but the underlying assumption remains.
Clustering assumes all factors have equal variance, which is never true in the real world.
Clustering challenges from missing values and data.
In clustering, missing values and dimensions can completely change the solution. While this problem exists in all subsets of machine learning, clustering is highly sensitive to it. This is due to the distance nature of clustering algorithms that recompute centroids based on available data.
Let’s revisit the example above.
CustomerID Money-Spent Shoe Size 1 $ 383.00 7 2 $ 888.00 11 3 $ 92.00 5 4 $ 288.00 9 5 $ 636.00 9 6 $ 528.00 6 7 $ 162.00 9 8 $ 117.00 6 9 $ 847.00 9 10 $ 609.00 8
Your manager has asked you to find out if any hidden groups or relations within this dataset are relevant to increasing sales at a local retail store.
But this time, you do not have the time-in-store variable.
When creating your clusters, the answer you get this time will completely differ from the groups you previously made.
What Are The Different Types Of Clustering Algorithms?
As a data scientist, you should always know what tools are in your toolbox.
Below, we will discuss the different clustering algorithms and some underlying assumptions involved with each one.
Partitioning clustering algorithms
Partitional clustering is one of the most common forms of cluster analysis.
Partitioning clustering can be broken down by the following:
- Subdivides the data into a subset of k groups
- These k groups are predefined
- Utilizes this criterion to create these groups
- Each group should have at least one point
- Each point should belong to exactly one group
The K-Means clustering algorithm is the most common and popular type of partitioning clustering.
Different Types of Partitioning clustering algorithms
Some of the more famous partitioning clustering algorithms are:
- K-Means
- K-Medoids
- PAM
- CLARA
- CLARANS
- K-Modes
- Fuzzy C-Means Algorithm
Hierarchical clustering algorithms
Hierarchical clustering is based on the idea that you do not need to predefine the number of clusters.
This can be done by a bottom-up approach or a top-down approach.
This is more technically known as the Agglomerative Approach (bottom-up) and Divisive Approach (top-down).
Hierarchical clustering is excellent for initial reads on data and can work with partitioning algorithms to give insights into an optimal k value.

Different Types of Hierarchical clustering algorithms
Some of the more famous Hierarchical clustering algorithms are:
- Agglomerative
- AGNES
- BIRCH
- CURE
- ROCK
- Chamelon
- Divisive
- DIANA
Density Based Clustering algorithms
Density-based clustering algorithms use the idea of dense areas.
This takes advantage of two core concepts: data reachability and data connectivity.
Density-based clustering doesn’t use distance as a cluster separation measure, instead focuses on dense areas of your subspace.
These algorithms are crucial in finding non-linear-shaped clusters based on density.
The most popular density-based clustering algorithm is DBSCAN, which has been proven to provide great clusters even if the data is noisy.
Different Types of Density Based clustering algorithms
Some of the more famous Density clustering algorithms are:
- STING
- DBSCAN
- CLIQUE
- DENCLUE
- OPTICS
- WAVE CLUSTER
Grid-based clustering algorithms
Grid-based clustering algorithms take a unique approach to clustering.
Instead of clustering each data point, these methods utilize a uniform grid to partition the problem into a finite domain.
Clustering is then performed on the grid and not on the data.
This gives it the advantage of being much faster than the other algorithms mentioned here, as the grid is usually substantially smaller than the number of points.

Different Types of Grid Based clustering algorithms
Some of the more famous Grid clustering algorithms are:
- MST Clustering
- OPOSSUM
- SNN Similarity Clustering
Model-based clustering algorithms
Model-based clustering is built upon the idea that your data follows some probability distribution.
Based on that assumption, we know what values should be present in our data, allowing us to form our clusters.
The most famous type of model-based clustering algorithm is the gaussian mixture model.
You can read more about this here.
Different Types of Model-Based clustering algorithms
Some of the more famous Model clustering algorithms are:
- GMM
- EM Algorithm
- Auto Class
- COBWEB
- ANN Clustering
Frequently Asked Questions
Clustering is a complicated subject; to help with that, we’ve answered some of the common questions below.
What are the challenges of K-means clustering?
The K-means algorithm attempts to minimize the sum of squared errors (SSE), which is a combinatorial optimization problem. Solving a combinatorial optimization problem is complex and computationally expensive. The K-means algorithm also can have different solutions based on various starting positions, making reproducibility challenging.
What are the assumptions of K-means clustering?
The primary assumption of K-means clustering is that your data is spherical (isotropic), allowing for groups to be created. K-means also assumes an equal variance for all features, equal prior probability for all clusters, and that the clusters are generally similar sized.
What is the difference between unsupervised machine learning and supervised machine learning?
The critical difference between unsupervised learning and supervised learning is that unsupervised learning is missing labeled data. Without labeled data, most loss functions and optimizations cannot be used. Unsupervised learning generally finds hidden commonalities and subgroups within a dataset.
Should you use an unsupervised machine learning algorithm on supervised data?
Unsupervised learning can be used on data that has labeled outputs, and this strategy is generally used to find subgroups or insights in a dataset. While classification and regression type problems cannot be solved using unsupervised machine learning, things like cost optimization and cluster analysis can prove insightful.
- How to Graph Chi Square Results [Boost Your Visualization Game] - February 20, 2026
- Is Cybersecurity Harder Than Software Development? [Uncover the Surprising Truth!] - February 20, 2026
- Unveiling the Internet’s Immensity [Shocking Facts Revealed] - February 19, 2026


