While K means clustering is one of the most famous clustering algorithms, what happens when you are clustering categorical variables or dealing with binary data?
K means clustering depends on the data points being continuous, where an average (mean) is easy to compute, and the distance between points matters.
At the bottom of this article is complete python code implementing this algorithm with sample data that is easily re-created.
K Mode Clustering Algorithms for Categorical Data
We will need to look at the data in a different way for clustering categorical or non-numerical data.
The K Modes clustering algorithm is another algorithm in the group of unsupervised machine learning algorithms.
The heart of this algorithm is its distance calculation, which defines clusters based on the distances from randomly selected cluster centroids.
While Euclidean distance is standard, this algorithm uses a type of binary distance over the dataset.
The number of clusters in the k modes algorithm will need to be defined when initialized.
Why This is Best for Categorical Variables
With K Means, since our values are discrete variables and can be calculated with numerical feature columns, we can utilize these to compute distance. (More on Discrete)
Therefore, we can utilize the euclidean distance concerning the cluster centroids to find which cluster our data should align with.
In a two-dimensional space, this formula will equate to the Pythagorean distance.
What if our categorical variable was the different colors that a specific patient wore to their appointment.
What is the euclidean distance from blue to orange? Or green to red?
You can not use the euclidean distance to determine how far categorical data are from each other.
How the K Modes Clustering Algorithm Works
The process of the k modes clustering algorithm is very similar to the k means clustering algorithm.
The slight difference, as we reviewed above, is the distance parameter.
Since we now want to cluster categorical variables or other categorical values, we utilize binary indicators to track differences.
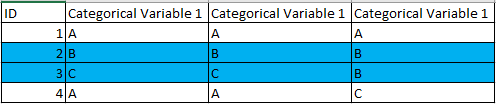
Steps of the k modes clustering algorithm
- Select k instances at random to serve as a cluster centroid (We select blue here)

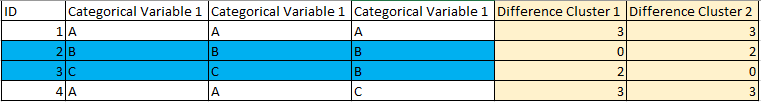
- Compare each data point with the cluster centroid. For any variables that are not equal, we add a 1, and if these variables are equal, we add a 0.
- Assign each data point to a cluster based on the lowest value; if tied, place it randomly (ID 1 and 4)
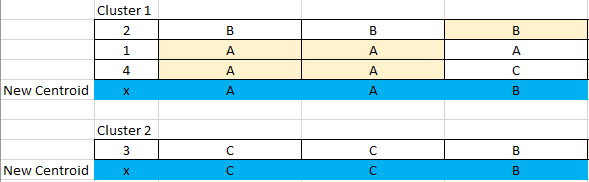
- For each cluster, each feature should have a mode.
- The mode of each feature for each cluster will now serve as the new cluster centroid.
- Repeat steps 2-5, using these new clusters until no data points change clusters.
Unsupervised Machine Learning Algorithms
Unsupervised machine learning algorithms provide us with new and innovative insights.
The different clusters and the data points within them will show us that some rows (in any dimensional space) are closely related.
When would you use the k modes clustering algorithm
In a hypothetical situation, you have a subset of customers that spend more money than other subsets when they receive emails.
Now, sending emails has a cost – and we do not want to send our emails to everyone.
It would make sense to keep sending this subset of customers our emails, but also start sending new customers that probably will end up in this subset (over time) these emails.
How can we immediately put new customers into this subset so we can send them emails?
This is where unsupervised machine learning algorithms, precisely the k modes clustering algorithm, come into play.
If we all had discrete data points, we could easily use the k means clustering algorithm to determine which customers should start receiving our emails.
Sadly, things like descriptions and other categorical data will be impossible to represent numerically (without some data mining and other data science tricks).
What to do when we have non-consistent data types
If our variables are a mix between categorical data and numerical data points, we will have to figure out a way to change our data so that we can either use K means or K modes.
One Hot Encoding
Let’s say we want to use k means clustering for our problem.
We know we can’t cluster our continuous data with this algorithm, so we need to convert these categorical variables into numerical values.
The easiest way to do this is by one-hot encoding each of the variables in our dataset, creating binary [1,0] variables for each option of each variable.
This will work out fine for tiny datasets and allow us to move forward with our problem.
However, when clustering large data sets, we can run into a scenario where we increase the number of variables so much we run into the Curse of Dimensionality. (More on that here)
Bucketing
You decide that your dataset was too large to OHE each of the variables, and you are terrified of the curse of dimensionality (who isn’t).
You now decide you want to use the k modes clustering algorithm to cluster your data.
We will “bucket” each of our discrete data column indices to do this.
You see a column that lists income when progressing through your customer dataset.
We will create buckets of incomes
- 0-25,000
- 25,000-50,000
- 50,000-100,000
- 100,000 +
With these buckets, we now assign a variable that says whether they are group 1, group 2, group 3, or group 4.
We know our k modes clustering algorithm can work with these clusters, and we assume we’ve solved our problem.
However, utilizing solutions like this makes us lose accuracy.
Think about it; group 4 could have someone making $110,000 a year and someone else making $5,00,000. But to our algorithm, it’s only going to see group 4.
I’m sure these two people have much different spending habits.
Again, someone making $0 has no income but will be grouped with someone making $25,000.
While this solution also works, the downsides are again expensive – something to take into account.
Another problem with this is that our grouping is not random.
Our own biases on creating the grouping boundaries can leak into the data, creating a situation where our accuracy will fall again.
K prototypes clustering algorithms
If you do not feel like messing with your data points and want to skip past the feature engineering part of deciding which path you want to choose, the KPrototypes algorithm can be utilized instead.
This package is also part of the Kmodes categorical clustering library and allows you to define categorical data in the call.
model = KPrototypes().fit_predict(data, categorical=[1, 6, 10])
Other Machine Learning Python Tutorials
We have a ton of different machine learning python tutorials built just like this one. This will help you get a deeper understanding of machine learning and the different ways you can implement these algorithms in python.
Links to those articles are below:
- Automatic Labeling of Topic Models (Python)
- Multivariate Polynomial Regression (Python)
- K Means Accuracy (Python)
- Chi-Square Test (Python)
Using Python for Clustering Categorical Variables
# install our kmodes categorical clustering library
!pip install kmodes
# install numpy
!pip install numpy
# imports
import numpy as np
from kmodes.kmodes import KModes
# let's assume that we have 10 different variables
# each of those variables can be broken down into 5 categories
# these categories (group 1, group 2, group3 etc.) can be represented just by a number
# each row is a unique ID
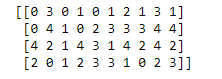
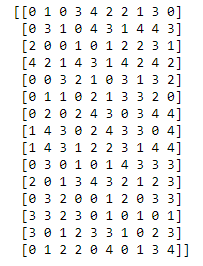
data = np.random.choice(5, (15,10))
print(data)
# let's define our model with 4 clusters initial clusters manually chosen
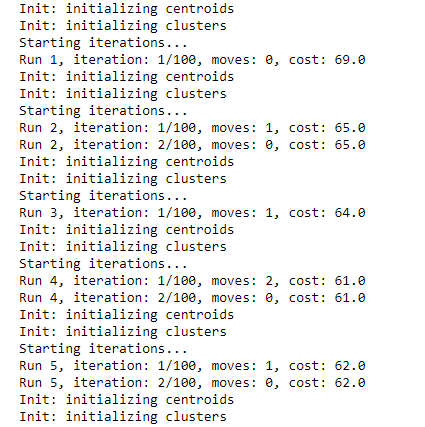
model = KModes(init='Huang', n_clusters=4, verbose=3)
clusters = model.fit(data)
# now we can see our cluster centroids, the center of each of our clusters
print(model.cluster_centroids_)