

Evaluating a clustering algorithm is much different than evaluating a classification or regression machine learning algorithm.
In a classification problem, labels will be given for the data points, giving you a reference point to create your accuracy measure.
What happens in unsupervised clustering algorithms when these reference data points and labels don’t exist?
(Full K-Means Clustering Algorithm in Python at the Bottom)
What is K-Means Used for?
K-Means is an unsupervised clustering algorithm used to create clusters of data points from data without labels. These clusters are great for finding groups with similar attributes. If your data has labels, a supervised algorithm will provide better insights than K-Means.
How Do You Measure Accuracy in K Means in Python?
In unsupervised learning, you won’t have target values to compare for your accuracy. This means accuracy is found in K-Means using something called the Silhouette Score, and this score takes advantage of the distance between clusters and the distance to each point.
Clustering Algorithm Accuracy vs. Classification Algorithm Accuracy
In Classification Algorithms, you can use regular accuracy scores comparing predicted values to class labels. Since you will not have original class labels in clustering, you’ll need to use a distance metric to figure out how good your clustering is.
For this type of calculation, the distance metric you use doesn’t usually matter, as long as it’s consistent.
What will matter is the algorithm that you choose.
To find the optimal K Clusters, we like to utilize the Silhouette Score at each cluster and each point.

What is Silhouette Score in K-means Clustering?
The Silhouette score in the K-Means clustering algorithm is between -1 and 1. This score represents how well the data point has been clustered, and scores above 0 are seen as good, while negative points mean your K-means algorithm has put that data point in the wrong cluster.
Think about it this way in the below example.
We have two clusters: Cluster Blue and Cluster Red.
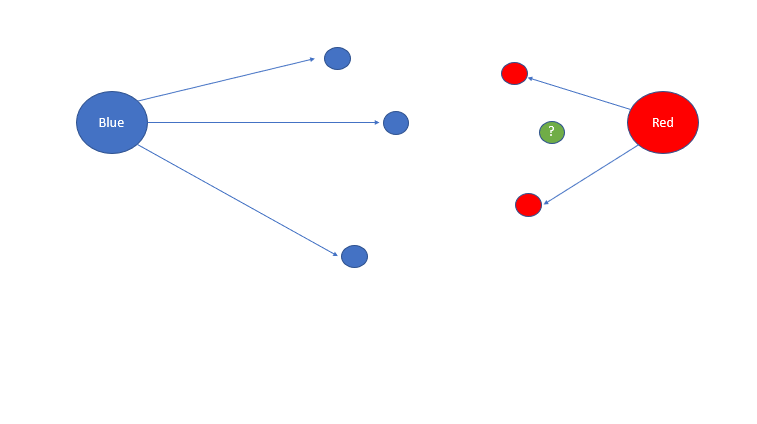
If I were to ask you what cluster you think the green circle belonged to, you would answer red.
However, what if this circle was classified as blue?
This circle would have a negative Silhouette score, as it’s closer to a different cluster than the one it’s assigned.
And as an inverse, if this green circle was classified as a red circle, it would have a value nearing one due to how close it is to the red centroid and how far it is from the blue centroid.
How is Silhouette Score Calculated?
Conceptually, the Silhouette score utilizes some distance parameter to measure how far a point is from its cluster compared to the centroid of a different cluster. If this value is negative, this data point is closer to another cluster than the one assigned.
What is the Average Silhouette Method?
The Average Silhouette Method takes the average Silhouette score of each data point for each cluster. This value can be misleading, as some individual data points of a cluster can have negative values, but the overall cluster value is positive. However, it can act as an accuracy proxy.
While this method has its uses in data science and as a data scientist, I suggest you look for individual silhouette scores at each point instead of the overall cluster average.

You want to find the cluster centers that minimize the number of negative silhouette values.
This strategy can change depending on what your end goal is.
How Do You Find K in K Means?
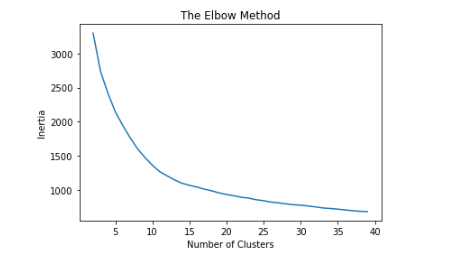
The easiest way to find K in K Means is by using the elbow method. Plot the inertia at many different values of K. When the graph looks like an elbow, select that as an initial K value moving forward. This value K will need to be validated.
In machine learning, people often make the mistake of maximizing their inertia value.
While this will give decent cluster assignments and labels, your overall clustering performance will be weak.
The next step, validating these clusters and labels, will lead you to better insights for you and your customers.
Realize that in K Means the most crucial parameter is K, and you have to do whatever you can to ensure that you have chosen the correct value.
How Do You Plot K In Python?
- Clean your Dataset and Import relevant packages.
- Define Potential K values in an array.
- Iterate through each value in the array
- Fit your K Means algorithm with each value
- Append the Inertia to Plot
- Continue till you’ve done every value
- Visualize the plot
# calculate k using python, with the elbow method
inertia = []

# define our possible k values
possible_K_values = [i for i in range(2,40)]

# we start with 2, as we can not have 0 clusters in k means, and 1 cluster is just a dataset

# iterate through each of our values
for each_value in possible_K_values:

    # iterate through, taking each value from
    model = KMeans(n_clusters=each_value, init='k-means++',random_state=32)

    # fit it on YOUR dataframe
    model.fit(df)

    # append the inertia to our array
    inertia.append(model.inertia_)

plt.plot(possible_K_values, inertia)
plt.title('The Elbow Method')

plt.xlabel('Number of Clusters')

plt.ylabel('Inertia')

plt.show()
K-Means Clustering Python (Code)
# import our models
from sklearn.cluster import KMeans
from sklearn.preprocessing import MinMaxScaler
from sklearn.metrics import silhouette_samples, silhouette_score
# cleaning, plotting and dataframes
import matplotlib.pyplot as plt
import pandas as pd
import numpy as np
# as always, we will use a publicly available dataset, from kaggle
# https://www.kaggle.com/datasets/arjunbhasin2013/ccdata
# put it in the same folder as this notebook
df = pd.read_csv("CC_DATA.csv")
# for this example, we're not goin to be dealing with nans (different tutorial for that :P)
df = df.dropna()
# we drop cust_id, as a ID column doesn't help us specifically for clustering
df = df.drop(columns=['CUST_ID'])
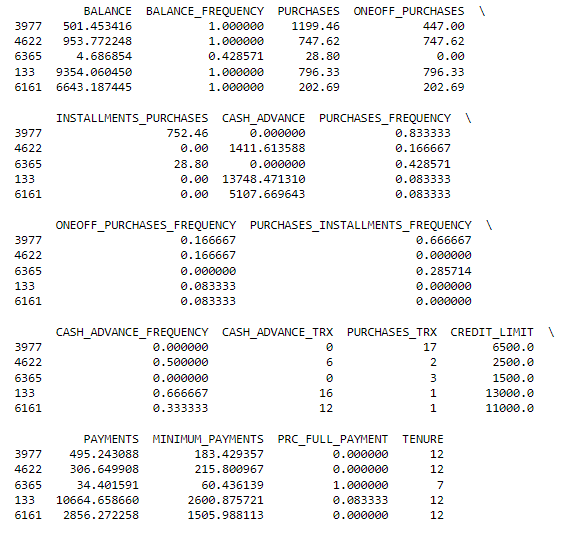
# let's see a random sample
print(df.sample(n=5))
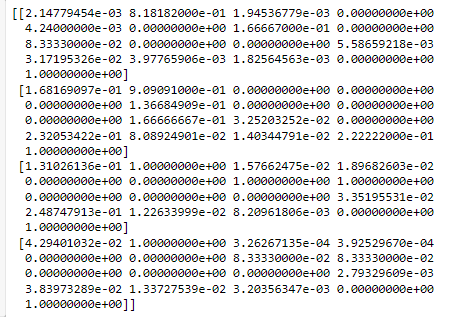
## lets apply min-max scaling to each row
# define our scaler
scaler = MinMaxScaler()

# scale down our data
df_scaled = scaler.fit_transform(df)

# see here four rows that are scaled
print(df_scaled[0:4])
# calculate k using python, with the elbow method
inertia = []

# define our possible k values
possible_K_values = [i for i in range(2,40)]

# we start with 2, as we can not have 0 clusters in k means, and 1 cluster is just a dataset

# iterate through each of our values
for each_value in possible_K_values:

    # iterate through, taking each value from
    model = KMeans(n_clusters=each_value, init='k-means++',random_state=32)

    # fit it
    model.fit(df_scaled)

    # append the inertia to our array
    inertia.append(model.inertia_)

plt.plot(possible_K_values, inertia)
plt.title('The Elbow Method')

plt.xlabel('Number of Clusters')

plt.ylabel('Inertia')

plt.show()
# now we have a problem, which K do we choose? anything past 15 looks really good, let's test 25

# let's use silhouette_samples and silhouette_score to find out

# new model
model = KMeans(n_clusters=25, init='k-means++',random_state=32)

# re-fit our model
model.fit(df_scaled)

# compute an average silhouette score for each point
silhouette_score_average = silhouette_score(df_scaled, model.predict(df_scaled))

# lets see what that score it
print(silhouette_score_average)

#0.261149550725173

# while that's nice, what does that tell us? there could still be a points with a negative value

# let's see the points
silhouette_score_individual = silhouette_samples(df_scaled, model.predict(df_scaled))


# iterate through to find any negative values
for each_value in silhouette_score_individual:
    if each_value < 0:
        print(f'We have found a negative silhouette score: {each_value}')
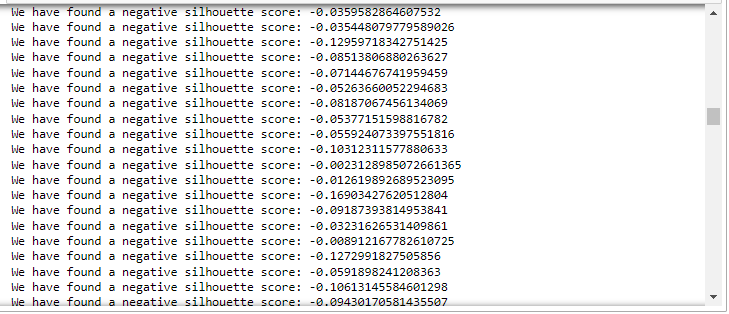
# wow, there is a ton!
# intially, 25 looked like a really good k value, now it's not seeming so!
# how can we find a value that optimizes this score?
# re-do our loop, try to find values with no negative scores, or one with the least!!
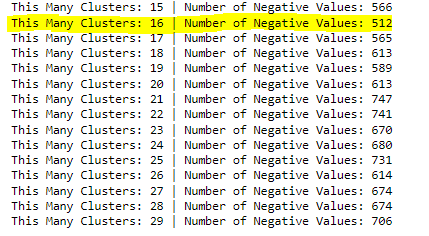
bad_k_values = {}
# remember, anything past 15 looked really good based on the inertia
possible_K_values = [i for i in range(15,30)]
# we start with 1, as we can not have 0 clusters in k means
# iterate through each of our values
for each_value in possible_K_values:
# iterate through, taking each value from
model = KMeans(n_clusters=each_value, init='k-means++',random_state=32)
# fit it
model.fit(df_scaled)
# find each silhouette score
silhouette_score_individual = silhouette_samples(df_scaled, model.predict(df_scaled))
# iterate through to find any negative values
for each_silhouette in silhouette_score_individual:
# if we find a negative, lets start counting them
if each_silhouette < 0:
if each_value not in bad_k_values:
bad_k_values[each_value] = 1
else:
bad_k_values[each_value] += 1
for key, val in bad_k_values.items():
print(f' This Many Clusters: {key} | Number of Negative Values: {val}')
# as we can see, inertia showed us that our value needed to be bigger than 15.
# but how did we choose past that?
# we optimized our K value utilizing the silhouette score, choosing 16 as it has
# the lowest amount of negative values
Frequently Asked Questions
This concept is a little dense, and we hope some of the answers below help you better understand the topic.
How Do You Use K Means Clustering in Python?
Once you’ve found your clusters, you should look to create specific strategies for each cluster. Since these clusters are mathematically very similar, optimizing decisions at the cluster level will lead to great results, and this could mean many different strategies for your dataset.
What is a Good Silhouette Score For clustering?
For clustering, you always want positive silhouette scores. A negative silhouette score symbolizes that a point is closer to the centroid of a different cluster than the cluster it’s currently assigned to. The maximum value of a silhouette score is 1.
What is a Good Silhouette score for Kmeans?
For Kmeans, a good silhouette score is above 0, which means for each data point, the silhouette score is above 0. You should re-do your clustering with a different K value if a silhouette score is negative or has a low average score.
What is a Good Silhouette Score in Clustering?
In clustering, you always want positive silhouette scores. The values of a silhouette score are between 1 and -1. A negative silhouette score symbolizes that a point is closer to the centroid of a different cluster than the cluster it’s currently assigned to.
Applicable Machine Learning Python Tutorials
These different articles will help you better understand machine learning and the different ways you can implement these algorithms in python.
Links to those articles are below:
- Why We Need Automatic labeling: Another Unsupervised Learning Algorithm based around NLP. We show you how to implement it in Python.
- Using Python for Clustering Categorical Variables: A Python implementation of K Mode clustering, mathematically very similar to K Means.
- Can Polynomial Regression Be Used for Multiple Variables: Another Python Coding Tutorial Utilizing a Machine Learning Algorithm we have here at EML.
- Chisquare test python: A full coding tutorial on the chi-square test, a fundamental test in statistics.
