

In data science, when trying to discover the trends and patterns inside of data, you may run into many different scenarios.
For example, you could run into a situation where the data is not linear, you have more than one variable (multivariate), and you seem to have polynomial features.
You still want to ensure that your predicted values are correct, but a non-linear relationship is hard to accurately model with a linear regression model.
The data science toolbox is constantly expanding.
While most are equipped with a linear model, they’d use it in a linear scenario; what happens when data has many independent variables that display non-linear features?
That’s when we need to start looking for other models to use
How would you handle this problem?
(Full Python Code with Example Data at Bottom)

What is Multivariate Polynomial Regression?
Multivariate polynomial regression is used to model complex relationships with multiple variables. These complex relationships are usually non-linear and high in dimensions. Once an accurate equation (model) is created or found, this equation can be used for future accurate predictions.
Let’s say you are trying to determine the relationship between multiple variables (in this scenario, we can think of variables X, Y, and Z).
You are interested in determining the relationship between one variable and the other.
You first need to figure out if there is any relationship in the data, and if so, we want to find the equation or function that relates those variables together.
You spend some time doing EDA and other visual data science techniques.
The first thing you notice is your data is not linear.

What is a Polynomial Regression Model
Polynomial regression is a basic linear regression with a higher order degree. This higher-order degree allows our equation to fit advanced relationships, like curves and sudden jumps. As the order increases in polynomial regression, we increase the chances of overfitting and creating weak models.
While most machine learning engineers or data scientists won’t have the equation up-front, a polynomial equation is straightforward to spot.
The order of a polynomial regression model does not refer to the total number of terms; it refers to the largest exponent in any of them.
Below, we’d see that this would be a n order polynomial regression model
y = bo + b1 x + b2 x^2 …..+ bn x^n + e
As we can see from this example, this looks very similar to our simple linear regression model, now with order n.
Collinearity in Polynomial Regression Model
Collinearity is a correlation found between your predictor variables, and this correlation can be positive or negative. If Collinearity in your quadratic polynomial regression model is a concern, fit the model with X and (X-Sample Mean)^2. This can fix any polynomial by increasing the squared term.
This trick will work for any order; continue to increase the squared value to match the order of that current variable.

What is Polynomial Regression Used For?
Polynomial regression is used similarly to linear regression to predict a value at some point. However, unlike linear regression, polynomial regression can estimate curves and more advanced relationships between the independent and dependent variables presented in our data.
Performing polynomial regression usually means we’re interested in the relationships between different variables in our dataset and the relationships these variables create on our outputs.
Can Polynomial Regression Be Used for Multiple Variables?
Polynomial regression can be used for multiple independent variables, which is called multivariate polynomial regression. These equations are usually very complex but give us more flexibility and higher accuracy due to utilizing multiple variables in the same equation.
Many have moved on to more complex models in machine learning to understand these relationships.

However, most of these algorithms are black-box, meaning that once relationships are found, we will no longer understand the relationship. [1,2]
This equation can be extracted and understood if these complex equations are found utilizing multiple linear regression or polynomial regression.
Is Polynomial Regression Still a Linear Regression?
Linear regression is a subset of polynomial regression, as linear regression is just polynomial regression in the first order. This means that linear regression is still polynomial regression. Once you get out of first order (like quadratic), these equations are no longer linear.

What is The Difference Between Linear Regression and Polynomial Regression?
The main difference between linear regression and polynomial regression is that polynomial regression can model complex relationships, while linear regression can only model linear relationships. However, linear regression is a subset of polynomial regression with just order one.
Polynomial Regression Model vs. Linear Regression Model
Before jumping into the code, we need to understand when we would use each model.
To understand, see these different lines below.
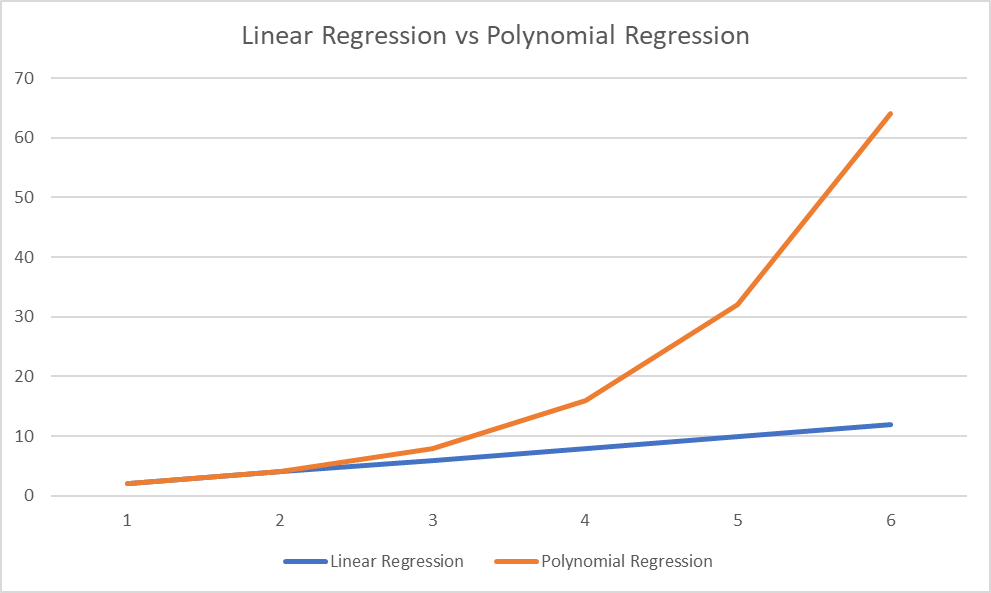
While both are under the polynomial regression model umbrella, only one is a linear relationship.
As we can see from the blue line, our equation is 2x.
For every value that x increases, y will increase by two.
This linear relationship will hold for any value of x.
For our orange line, we quickly see as our x values grow across the bottom, the gap between our x and y value grows.
The equation for this line is 2^x.
While these lines are equal at [0,1,2], as x increases, the deviation between these lines grows.
This is because this function’s derivative (slope) is 2x.

Full Multivariate Polynomial Regression Python Code
# make sure to import all of our modules
# sklearn package
from sklearn.preprocessing import PolynomialFeatures
from sklearn.linear_model import LinearRegression
from sklearn.metrics import mean_squared_error
# dataframes
import pandas as pd
# computation
import numpy as np
# visualization
import matplotlib.pyplot as plt
# dataset
# https://www.kaggle.com/datasets/ciphernine/brooklyn-real-estate-listings
# place it in the same folder as this workbook
df = pd.read_csv('brooklyn_listings.csv')
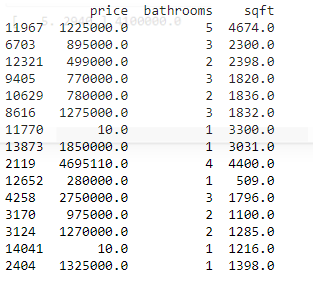
# for this example, we're going to estimate the price with sqft, bathroom, and bedrooms
df = df[['price','bathrooms','sqft']].dropna()
# show some random lines from our data
print(df.sample(n=15))
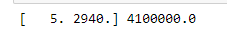
# seperate out our x and y values
x_values = df[['bathrooms','sqft']].values
y_values = df['price'].values

# visual
print(x_values[0], y_values[0])
#define our polynomial model, with whatever degree we want
degree=2

# PolynomialFeatures will create a new matrix consisting of all polynomial combinations
# of the features with a degree less than or equal to the degree we just gave the model (2)
poly_model = PolynomialFeatures(degree=degree)

# transform out polynomial features
poly_x_values = poly_model.fit_transform(x_values)

# should be in the form [1, a, b, a^2, ab, b^2]
print(f'initial values {x_values[0]}\nMapped to {poly_x_values[0]}')

# [1, a=5, b=2940, a^2=25, 5*2940=14700, b^2=8643600]

# let's fit the model
poly_model.fit(poly_x_values, y_values)

# we use linear regression as a base!!! ** sometimes misunderstood **
regression_model = LinearRegression()

regression_model.fit(poly_x_values, y_values)

y_pred = regression_model.predict(poly_x_values)

regression_model.coef_

mean_squared_error(y_values, y_pred, squared=False)
# check our accuracy for each degree, the lower the error the better!
number_degrees = [1,2,3,4,5,6,7]
plt_mean_squared_error = []
for degree in number_degrees:

   poly_model = PolynomialFeatures(degree=degree)

   poly_x_values = poly_model.fit_transform(x_values)
   poly_model.fit(poly_x_values, y_values)

   regression_model = LinearRegression()
   regression_model.fit(poly_x_values, y_values)
   y_pred = regression_model.predict(poly_x_values)

   plt_mean_squared_error.append(mean_squared_error(y_values, y_pred, squared=False))

plt.scatter(number_degrees,plt_mean_squared_error, color="green")
plt.plot(number_degrees,plt_mean_squared_error, color="red")
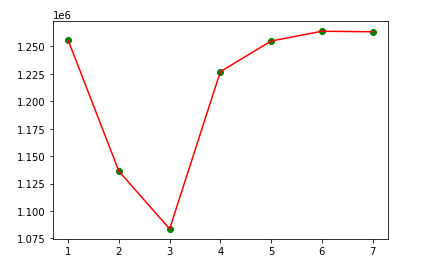
From above, we see our model did best when our degree=3, meaning a cubic function helped us predict housing pricing most accurately.
Relevant Machine Learning Python Tutorials
We have a ton of additional machine learning python tutorials built just like this one.
This will help you better understand machine learning and the different ways you can implement these algorithms in python.
Links to those articles are below:
- Automatic Labeling of Topic Models In Python: A Python implementation of a famous NLP algorithm, topic models.
- Chi-square in python: A Python implementation of chi-square test, used for independence.
- K Mode Clustering In Python: A Python implementation of K Mode clustering, a close friend of K Means.
- K Means Clustering in Python: A Python implementation of K means clustering, an awesome unsupervised learning algorithm.
Frequently Asked Questions
We understand that multivariate polynomial regression in python is complicated.
We hope the answers listed below will help clear up any difficulties you are having.
As always, be sure to send us an email if you still have any questions.
Can you do polynomial regression with multiple variables?
Polynomial regression can be used for multiple variables; this is called multivariate polynomial regression. These equations are usually very complicated but give us more flexibility and higher accuracy due to utilizing multiple variables in the same equation.
Can a polynomial have 3 variables?
A polynomial can have infinite amounts of variables. The prefix poly means “many” and the suffix nomial means “variable.” This implies a polynomial can have 3 variables or many more. If there is one variable, this is still a polynomial.
Can you run a regression with multiple variables?
Regression can be run with any number of variables, which is called multiple linear regression and multivariate polynomial regression. However, to avoid the curse of dimensionality, the number of variables should never be higher than the rows of data in the training set.
What will happen when you fit degree 2 polynomial in linear regression?
If you fit degree 2 polynomial in linear regression, you’ll have a wildly inaccurate model. This is because a linear relationship can not be accurately modeled by a quadratic equation (degree 2 polynomial). A linear regression assumed degree 1 during fitting.

This was very helpful thank you! Exactly what I was looking for!
Hi there.
I have a data set that contains 10 independent variables and 1 dependent variable. Using the code in this article, it computed that my polynomial should be of degree 4.
When I fit my ‘linear’ regression model, is it actually forming polynomial relationships of degree 4, or is it just performing normal linear regression? The accuracy is not very good if I set my degree to 4.
Is this actually multivariate polynomial regression? If not, do you know how I can do this?
Thank you!
Hey Dominique,
I’m glad that the code worked!
Sometimes many think they’re after this post but are really after something like a regression spine.
Maybe this article will help (it’s from someone else’s blog)
Dear Dylan Kaplan,
The code is useful and thanks for sharing it.
I put the sample code below and need your help to
confirm one question:
At line 10, the parameter values passed to mean_squared_error()
are “y_value” and “y_pred”.
“y_value” is the result fetched from the Excel file.
“y_pred” is the result returned by line 8.
But at line 4, “poly_model.fit(poly_x_values, y_values)” is executed.
What does this line take effect?
This line doesn’t generate any result.
What is the relation between line 4 and line 10?
Thanks very much.
======================================================
1 poly_model = PolynomialFeatures(degree=degree)
2
3 poly_x_values = poly_model.fit_transform(x_values)
4 poly_model.fit(poly_x_values, y_values)
5
6 regression_model = LinearRegression()
7 regression_model.fit(poly_x_values, y_values)
8 y_pred = regression_model.predict(poly_x_values)
9
10 plt_mean_squared_error.append(mean_squared_error(y_values, y_pred, squared=False))
Sincerely
ChienChi
Hi ChienChi,
poly_model is defined in the for loop!
A normal “fit” method won’t have any output, as it’s not transforming (as seen in the for loop).
a fit_transform is a little different than a fit method.
Dylan
Dear Dylan,
Thank you for great explanation. I need to ask 1 thing.
I want to check the regression output after fitting the model. How to do that?
Thanks
Hello! what do you mean by the output?
You’ll need to use it to predict something to get an output for a model.
Dylan
Hi Dylan,
Thanks so much for this code, I used it and it worked for multivariate polynomial regression. However, if I want to visualise it to see the polynomial fit, I get the the error that my X (2 variables) and y (1 variable) are not of same dimension. How can I view my polynomial fit using scatter or line plot.
Thanks