

While chi-square tests are very powerful, they are often misused.
This hypothesis test is commonly used to test three different things.
- Chi-Square Goodness of Fit Test
- Used to test if a categorical variable is from a distribution
- Chi-Square Test of Independence
- Used to test if two categorical variables are related to each other
- Chi-Square Test of Homogeneity
- Used to test if two or more sub-groups of the same population share similar distributions for a single categorical variable
In a later post, we will dive into the goodness of fit test, but this one will focus primarily on independence and homogeneity.
(Full Chi-Square Test of Independence Python Code at the bottom)
Chi-Square Test
The Chi-Square Test is a test to see whether or not two categorical variables are independent.
This is extremely valuable, as other things in machine learning are based on the assumption of independence.

Many people get confused about the different tests based on the chi-squared distribution.
While the three we will be focused on in this blog are very important, they are used in different situations.
I do want to make a distinction about independence.
Rows of data that are not independent due to something underlying (like in time series) throughout a dataset is a different type of independence than we are testing here.
Think of chi-square (in data science terms) as column independence, where the type of independence referenced above is more focused on row independence. (Read More Here)
What Does A Chi-Square Test Of Independence Tell You?
The chi-square test will tell whether two categorical variables are independent.
This is crucial as many other statistical tests cannot be applied if variables are not independent of one another.
For example, Naive Bayes assumes that all of your variables are independent.
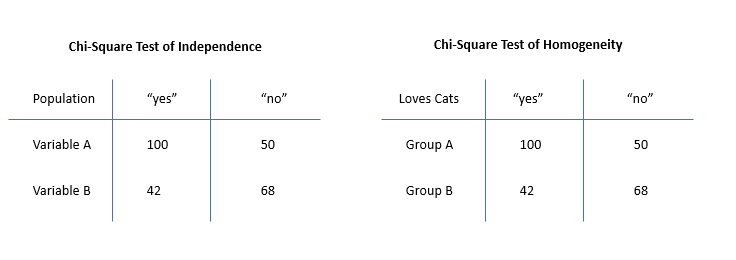
What is The Difference Between A Chi-Square Test of Homogeneity and Independence?
The difference between the chi-square test of homogeneity and independence is that the test of independence tests if two categorical variables are related to each other in a population, while the test of homogeneity tests if two or more subgroups in the same population share distribution for a chosen categorical variable.
While these sound very similar, they’re not very close in practice.
It’s easiest to see with an example.
Let’s say you have 1000 cats.

Like any great data science project, you have a ton of perfect clean data. (haha)
The first thing you are interested in is judging if the type of cat and the color of the cat is independent.
For this, we would use our chi-square test of independence.
We will utilize the full population, and our null hypothesis is that these variables are independent.
This is the standard null hypothesis in any chi-square test of independence.
You’d compute your test statistic and critical value at whatever alpha value you desire, and if your test statistic is higher than your critical value, we reject the null hypothesis.
This would mean that these categorical variables are not independent for your population.
In p-value terms, this would mean your p-value is very low.
Most use a p-value of .05, and we’d check if our computed p-value is below our threshold.
If our value is below .05, we can say this is statistically significant. Meaning we reject the null hypothesis.
Remember, one minus your computed p-value is the probability that the alternative hypothesis is true, and if your p-value is very small, that probability is very high.
Now let’s say you were interested in if two different types of cats have the same frequency of colors.

This would compare two sub-groups (not variables!!) from the same population.
For this, we would use the chi-square test of homogeneity.
Many of the steps past this point are similar to the steps above.
You would set up your null hypothesis, assuming that the distribution for the categorical variable you are looking at is the same for both sub-groups.
You would build your contingency table and utilize observed and expected frequencies to compute the test statistic.
Depending on the chi-squared test statistic values obtained above, you can choose to either reject or not reject the null hypothesis.
As we can see, while both are great statistical methods, they have different uses.
Make sure you understand your specific situation to utilize the correct statistical test.
What Does A Chi-Square Test of Independence Compare?
The chi-square test of independence compares two categorical variables to see if they are independent or not. Independence of variables is essential for further testing, as some statistical methods cant be applied to data that is not independent.
Why Do We Use Categorical Variables In The Chi-Square Test?
You use categorical variables in the chi-square test because the test statistic is computed based on frequencies. If the data is not categorical, there will be no way to bucket the responses. We can create a contingency table with these frequencies and compute the test statistic.
While this may seem odd, think about a data set around different heights.
How would you put these height values into categories?
You may have some heights that ended up being near each other (or the same), but most will be over a wide range of values. (depending on how in-depth measuring was)
This makes it nearly impossible to create our contingency tables.
There is a strategy to “bucket” these numerical columns, to pseudo convert them into buckets that can be utilized as a categorical variable. (Read More Here)
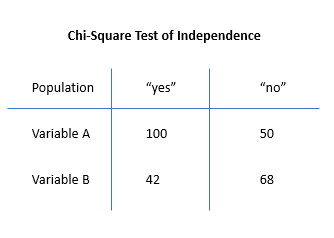
Now, consider if we had a categorical variable, either “Yes” or “No.”
It quickly becomes very easy to compute our contingency table, looking something like this.
Why Do We Reject The Null Hypothesis With A Low P-Value?
We reject the null hypothesis with a low p-value because (1 – p-value) is a calculated representation that the alternative hypothesis is true. As the p-value gets closer to zero, we increase our chances that the alternative hypothesis is true, meaning we must reject the null hypothesis.
What is Chi2 Contingency?
The chi2 contingency function is a function in Scipy. This function, which takes in a contingency table created from categorical values, evaluates the chi-square statistic and the p-value for that contingency table.
We can use these values to decide whether to reject or not reject the null hypothesis that these variables are independent.
How To Make A Contingency Table In Python
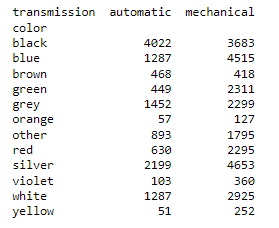
Making a contingency table in Python is straightforward. Import the Pandas package and utilize the crosstab function.
# contigency table in python with pandas
compare = pd.crosstab(df['color'],df['transmission'])

#an example contigency table from pandas crosstab
print(compare)
How Do You Do A Chi-Square Test In Pandas?
To do a chi-square test in pandas, you need to convert the data into a contingency table with each frequency. The easiest way to do this is to utilize the Pandas crosstab function. Once done, use the Scipy package chi2 contingency function to compute the chi-square statistic and p-value.
Full Chi-square Test Of Independence Python Code
# import your modules
import numpy as np
import pandas as pd
import scipy.stats as stats
# as always, we will use a publicly
# available dataset for the demo
# lets use https://www.kaggle.com/datasets/lepchenkov/usedcarscatalog
# put it in the same path as this notebook
df = pd.read_csv("cars.csv")
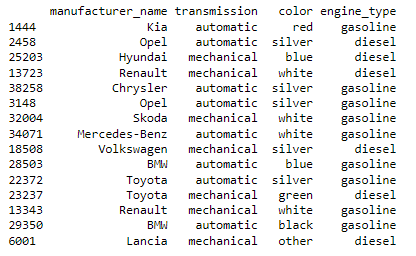
# for this example, let's focus on transmission, color, engine_type
df = df[['manufacturer_name','transmission','color','engine_type']]
print(df.sample(n=15))
# contigency table in python with pandas
compare = pd.crosstab(df['color'],df['transmission'])

#an example contigency table from pandas crosstab
print(compare)
# are these variables independent?
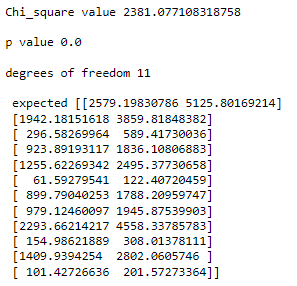
chi2, p, dof, ex = stats.chi2_contingency(compare)
print(f'Chi_square value {chi2}\n\np value {p}\n\ndegrees of freedom {dof}\n\n expected {ex}')
# looks like our p value is very low
# these categorical variables are not independent
Other Machine Learning Python Tutorials With Code
These additional articles will help you better understand machine learning and the different ways you can implement these algorithms in Python.
Links to those articles are below:
- Automatic Labeling of Topic Models Python: A Unsupervised Learning Algorithm based around NLP. We show you how to code it in Python.
- K Mode Clustering Python: A Python implementation of K Mode clustering (categorical values).
- Is Polynomial Regression Still a Linear Regression: Another Python Coding Tutorial Utilizing a Fundamental Machine Learning Algorithm using independent variables.
- Clustering Algorithm Accuracy vs. Classification Algorithm Accuracy: Now that your variables are ready and independent, you can move towards actually using a classification algorithm.

Great delivery. Sound arguments. Keep up the great effort.