In data science, there are many different ways to slice the pie. While many refer to independent and dependent variables differently, they usually mean the same thing.
Your predictor variables are your independent variables, and with these, you’ll (hopefully) be able to predict your criterion variable (dependent variable).
In the rest of this 3-minute guide, we’ll go over a deep-dive into criterion vs. predictor variables, what each of these means, and supply you with some code at the bottom to show you how to split each of these out in the python coding language.
This one is embarrassing to mess up, but don’t worry; we’ve got your back.

What is a criterion variable?
Simply, a criterion variable is a variable we’re trying to predict. Many machine learning projects refer to this as Y or as our target variable.
The best way to identify your criterion variable is to identify the variable that you care about.
In a business context, this will be the variable that most closely resembles the problem you’re trying to solve.
For example, if your boss wants to build a model that can predict future sales of your company’s product, the criterion variable is the variable that most closely resembles sales.
It’s worth noting that a criterion variable could be a relationship of multiple variables (Or something much more complicated).
Let’s say your boss wants you to do a research study for your company and needs you to look at the average amount spent per stock in the last six days.
You open your data and have these variables:

In this scenario, we’ll have to find a way to combine our two variables to get the outcome that we need.

Now that we’ve combined our two variables, the result we get is our official criterion variable.
This new variable will help us explain our solution, and we can describe the correlation and relationship between the other predictor variables in-depth.
What is a Predictor variable?
A predictor variable is a variable used to predict another variable’s value, and these values can be utilized in both classification and regression. In most machine learning and statistics projects, there will be many predictor variables, as accuracy usually increases with more data.
For example, if you want to predict the price of a house, the predictor variables might be the size of the house, the number of bedrooms, the number of bathrooms, and the location.

The predictor variable sometimes is referred to as the independent variable. Since we know in machine learning projects, there is generally more than one predictor variable; these are sometimes referred to as “X.”
Once our target (criterion variable) is split from our independent variables (predictor variables), many data scientists will refer to this batch of predictor variables as just variables.
What is the difference between a criterion variable and a predictor variable?
The main difference between a criterion variable and a predictor variable is that a predictor variable is used to find the values of the criterion variable. While there can be many predictor variables in a project, there is usually only a single criterion variable.
One of the most critical steps in any project design or machine learning project is understanding the business context and how that relates to selecting the correct criterion variable.
What do a Criterion Variable and Predictor Variable Look Like in a Machine Learning Project?
Since we now know that predictor variables are variables used to predict the value of a criterion variable, we can discuss the different types of predictor variables that exist.
There are two main types of predictor variables: categorical and quantitative.
Categorical predictor variables are those that can be divided into groups or categories. For example, a categorical predictor variable could be color, with the categories: red, blue, and green.
Quantitative predictor variables are those that can be quantified or measured. For example, a quantitative predictor variable could be age, with the values being the ages of different individuals.
Python Example of Criterion and Predictor Variables
Your boss wants you to build the most accurate model you can to predict what someone’s salary (in dollars) will be.
Your boss has provided you with the dataset below:
import pandas as pd

df = pd.read_csv('ds_salaries.csv')


df.head()

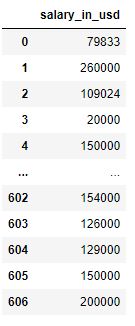
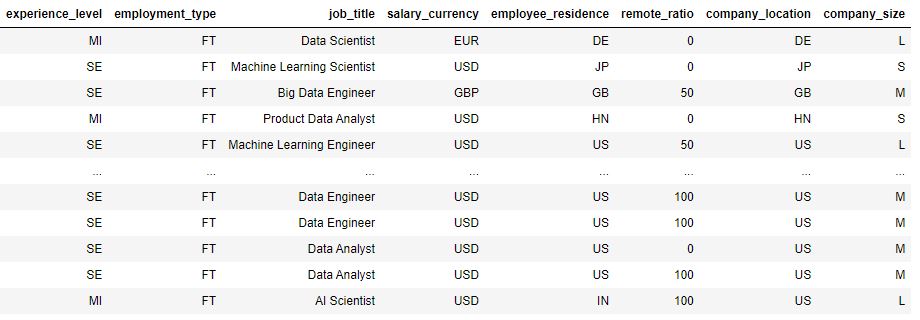
You quickly notice that a good criterion variable would be salary_in_usd, and you split that out from the rest of the data.
## split our predictor and criterion variables

criterion_variable = df[['salary_in_usd']]

predictor_variables = df[['experience_level','employment_type','job_title',
                          'salary_currency','employee_residence','remote_ratio',
                          'company_location','company_size']]
Our Criterion Variable:

Our Predictor Variables (Mix of Quantitative and Categorical)

Now that you have your datasets, you’re ready to start modeling!
Do Criterion Variables Exist in Unsupervised Learning?
Criterion variables do not exist in unsupervised learning. Since unsupervised learning does not have labeled data, we do not have a dependent variable (criterion variable). These projects will only have predictor variables that we use to try to draw insights.
Other Articles in our Machine Learning 101 Series
We have many quick guides that go over some of the fundamental parts of machine learning. Some of those guides include:
- Reverse Standardization: Now that you can split your data correctly, use this guide to build your first model.
- CountVectorizer vs. TFIDFVectorizer: Two classical NLP algorithms; you’ll need correct data splitting here to take these two on.
- Welch’s T-Test: Do you know the difference between the student’s t-test and welch’s t-test? Don’t worry, we explain it in-depth here.
- Parameter Versus Variable: Commonly misunderstood – these two aren’t the same thing. This article will break down the difference.
- Feature Selection With SelectKBest Using Scikit-Learn: Feature selection is tough; we make it easy for both regression and classification in this guide.
- Normal Distribution vs. Uniform Distribution: Now that you know the difference between your variables, you can now start to understand the different distributions these variables can have.
- Heatmaps In Python: Visualizing data is key in data science; this post will teach eight different libraries to plot heatmaps.
- Gini Index vs. Entropy: Learn how decision trees make splitting decisions. These two are the workhouse of top-performing tree-based methods.

