

Normal Distribution Vs. Uniform Distribution Python Code Using Pandas
import numpy as np
import pandas as pd

# generate an array of normal values
normal_distribution = np.random.normal(size=100000)


# generate an array of uniform values
uniform_distribution = np.random.uniform(size=100000)

# create a dataframe to plot them
df = pd.DataFrame({'Normal': normal_distribution,
                 'Uniform': uniform_distribution})


print(df.hist(bins=50))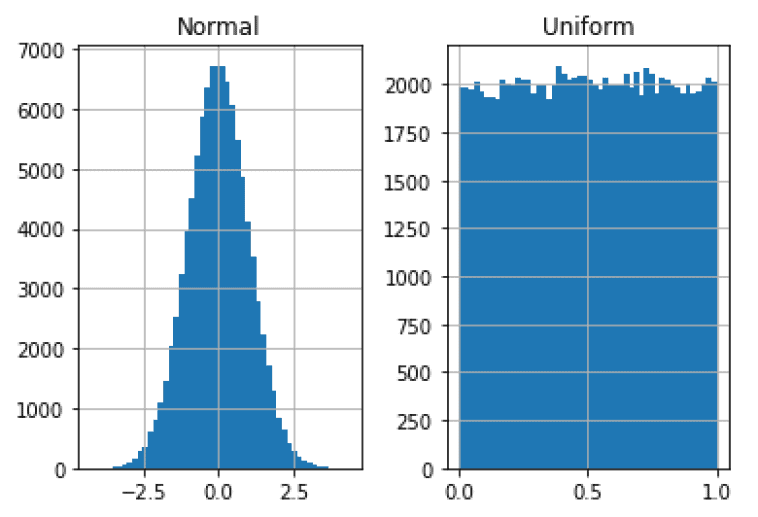
What is a Normal Distribution?
A normal distribution, also known as a bell curve, or gaussian, is a probability distribution that is used in statistics and machine learning.
The normal distribution is centered around its mean with a tail stemming out in each direction.
This distribution is extremely common and describes common things like heights and IQ.
While the Normal distribution can have any mean and standard deviation, the standard normal distribution is a distribution that always has a mean of zero and a standard deviation (and variance) of one. This is a key difference that many confuse.

What is a Uniform Distribution?
A uniform distribution is a probability distribution where all possible values have the same probability of occurring.
Since all values are equally likely to show up, as n increases, the continuous uniform distribution takes on a rectangular shape once graphed.
Hints why this distribution is part of the rectangular distribution family.

A discrete uniform distribution occurs when an event has the same chance of happening as any other event within a given set of events, but the choices are finite, like dice rolls.
A continuous uniform probability occurs when there is an infinite number of choices with equal chances of happening. The simplest example is choosing a random variable between [0,1].
In data science, where do we see the normal distribution?
The normal distribution is ubiquitous in data science. It appears in many forms, including the bell curve.
The normal distribution is often used to model real-world phenomena, such as IQ scores and height.
Many data scientists will work to transform their data, using different transformations to make their dataset resemble a normal distribution.
In data science, where do you we the uniform distribution?
In data science, you will often see a uniform distribution when working with random numbers. This is because uniform distribution is a good way to generate random numbers that are evenly distributed between a given range.
One sampling method, called reservoir sampling, uses random sampling to draw samples from streaming data.

The idea is that once you’ve drawn enough random samples from your streamed data, you’ll find that the distribution will resemble the original (and unknown) distribution.
Other Articles In Our Machine Learning 101 Series
We have many quick guides that go over some of the fundamental parts of machine learning. Some of those guides include:
- Gini Index vs. Entropy: Learn how decision trees make splitting decisions. These two are the workhouse of top-performing tree-based methods.
- Heatmaps In Python: Visualizing data is key in data science; this post will teach eight different libraries to plot heatmaps.
- Parameter Versus Variable: Commonly misunderstood – these two aren’t the same thing. This article will break down the difference.
- Reverse Standardization: Another staple in our 101 series, a great article teaching you about scaling and standardization.
- Criterion Vs. Predictor: One of the first steps in statistical testing is the independent and dependent variables.
- CountVectorizer vs. TfidfVectorizer: Interested in learning NLP? This is a great guide to jump into after learning about two famous distributions.
- Welch’s T-Test: Do you know the difference between the student’s t-test and welch’s t-test? Don’t worry, we explain it in-depth here.
- Feature Selection With SelectKBest Using Scikit-Learn: Feature selection is tough; we make it easy for both regression and classification in this guide.
