

As its names suggest, “outliers” refers to a group or singular piece of information that doesn’t seem to fit in with the other information. Our job as data scientists is to identify and deal with these potential outliers.
In this 4-minute read, we’ll cover outlier detection in data mining, the most common outlier detection methods, and how to code each in python WITH an example.
Outlier detection is a fundamental part of being a data scientist
You can’t skip this one.

Understand Your Problem Before Eliminating Outliers
You know the famous saying, if the only tool you have is a hammer, you tend to see every problem as a nail? That applies here with outliers.
Sometimes, the problem you’re trying to solve needs outliers.
For example, most of the data points you’re trying to detect in anomaly detection will be outliers.
If you ran your outlier detection techniques and then got rid of these points, you’d be getting rid of your most important data!
Before getting rid of your outliers or using any of the techniques below, ensure you fully understand the problem you are trying to solve.
With that being said…
What are the most common outlier detection methods?
- IQR (InterQuartile Range)
- Cooks Distance
- Z-Score
- DBSCAN
How to find outliers in data mining with python
Below, we’ll introduce each outlier detection method and write up some Python code so you can quickly implement these on your projects.
Outlier Detection With InterQuartile Range In Python
The way IQR works is by setting up a “barrier” around the first quartile (Q1) and third quartile (Q3) of our data. We calculate this barrier by finding the IQR between Q3 and Q1:
IQR = Q3 – Q1
Once found, we continue to set up our barrier on the bottom with:
Q1 Barrier = Q1 – 1.5 * IQR
And secure the top with our barrier:
Q3 Barrier = Q3 + 1.5 * IQR
Once these two are established, anything outside of these values are seen as outliers.
# as always
# public dataset
#https://www.kaggle.com/datasets/ruchi798/data-science-job-salaries
import pandas as pd
import numpy as np
# read in our data
df = pd.read_csv('ds_salaries.csv')
# find outliers for numerical columns
# expand this function to how you see fit
# add as many columns in the array as you need
for col in ['salary']:
# find our quartiles
q1, q3 = np.percentile(df[col],[25,75])
# find our range
IQR = q3 - q1
# lower barrier
Q1_Barrier = q1 - 1.5 * IQR
# upper barrier
Q3_Barrier = q3 + 1.5 * IQR
# mark outliers # if less than q1b and more than q3b
df[col+'_Outlier'] = np.where((df[col]<Q1_Barrier) | (df[col]>Q3_Barrier), \
1, 0) # we mark it with a 1 -> or 0
# lets see our outliers
# you can always filter on your newly made columns
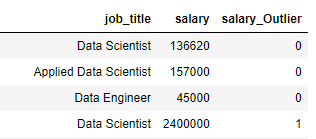
df[['job_title','salary','salary_Outlier']].sample(n=50)Our code returns many outliers, like the one below (Where a data scientist is making a whopping $240,000)
Outlier Detection With Cooks Distance In Python
Cook’s distance takes a little bit of a different approach than IQR. Cook’s distance estimates how much influence a data point has.
If a data point is seen as too influential To do, we’ll need a regression model. Sadly, Cook’s distance does not work well with non-numerical data.
A standard rule is looking for points that are higher in influence than 4/n, where n is the length of your data frame.
I think this rule is a bit strict, and graphical analysis to find these influential points works much better (in my experience).
John Fox seems to agree; his booklet on regression diagnostics says to find values D that are substantially larger than the rest.
# as always
# public dataset
#https://www.kaggle.com/datasets/ruchi798/data-science-job-salaries
import pandas as pd
import numpy as np
import statsmodels.api as sm
import matplotlib.pyplot as plt
# read in our data
df = pd.read_csv('ds_salaries.csv')
y = df['salary'].values
X = df[['work_year','experience_level','employment_type',\
'salary_currency','company_size']]
# prep our data with ohe
X_ohe = pd.get_dummies(X)
# compute our model
ols = sm.OLS(y, X_ohe).fit()
# distance metrics
distances = ols.get_influence().cooks_distance
# we grab the values of cooks distance
plt.scatter([val for val in range(0,len(df))], distances[0])
# show each one
plt.show()
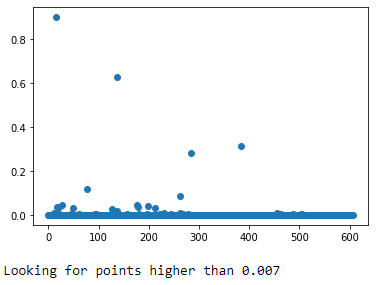
print(f'Looking for points higher than {round(4/len(df),3)}')We show the 4/n rule at .007, symbolizing that nearly everything in our dataset is “influential.”
The graphing method that John Fox suggests shows about ~5 points that I’d take a deeper look at.
Outlier Detection With Z Score In Python
The Z score is vital to machine learning and statistics. Basically, this value is used to tell you how far away this data point is from the mean. If we assume a normal distribution, then
- 68% of our data should be within 1 standard deviation of the mean
- 95% of our data should be within 2 standard deviations of the mean
- 99.7% of our data should be within 3 standard deviations of the mean
We can utilize this idea to find outliers:
# as always
# public dataset
#https://www.kaggle.com/datasets/ruchi798/data-science-job-salaries
import pandas as pd
import numpy as np
# read in our data
df = pd.read_csv('ds_salaries.csv')
# find outliers for numerical columns
# expand this function to how you see fit
for col in ['salary']:
# find our standard deviation
std = np.std(df[col])
# find our mean
mean = np.mean(df[col])
# mark outliers # if its more than 3 deviations from the
# mean, we mark it
df[col+'_Outlier'] = np.where(((df[col]-mean)/std) > 3, 1, 0)
# lets see our outliers
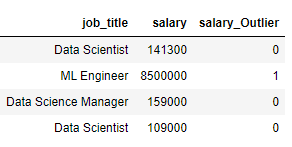
df[['job_title','salary','salary_Outlier']].sample(n=4)We see the results below:
One of the problems with the Z score is the assumption of normality.
If we re-plot that same column from above:
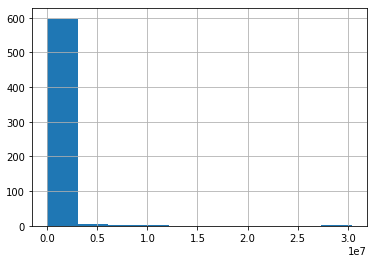
I’d have a hard time defending this variable as normal. Even with the normality assumption being shaky, utilizing the Z score is still an efficient way to eliminate outliers.
Outlier Detection With DBSCAN In Python
Instead of focusing primarily on distance like other clustering methods, DBSCAN works by finding places in your subspace that are densely packed. The DBSCAN clustering method requires two parameters: eps and min_samples.
Below, we choose an eps (how close points of the same cluster should be) of 1.5 and min_samples (minimum number of points to form a cluster) of 3.
We cluster our dataset, and if our parameters cannot cluster any points in the subspace, DBSCAN will label them as -1.
We can then go back through and remove these -1 points from our dataset.
# imports
import numpy as np
import pandas as pd
from sklearn.cluster import DBSCAN
from collections import Counter
# as always
# public dataset
#https://www.kaggle.com/datasets/ruchi798/data-science-job-salaries
# read in our data
df = pd.read_csv('ds_salaries.csv')
# seperate y
y = df['salary'].values
# seperate x
X = df[['work_year','experience_level','employment_type',\
'salary_currency','company_size']]
# prep our data with ohe
model_data = pd.get_dummies(X)
# run dbscan
clusters = DBSCAN(eps=1.5, min_samples=3).fit(model_data)
# our -1 points are our outliers
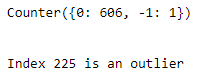
all_points = Counter(clusters.labels_)
print(all_points)
# find index of outliers
for i,val in enumerate(clusters.labels_):
if val == -1:
print(f' \n\nIndex {i} is an outlier')Of our 607 data points, DBSCAN says the data object at index 225 is an outlier.
Final Thoughts on Outlier Detection in data mining
Above, we reviewed and wrote code for the following outlier detection methods in python:
- IQR (InterQuartile Range)
- Cooks Distance
- Z-Score
- DBSCAN
Detecting outliers in data mining is pivotal for accurate models.
As a data scientist, you can use the above methods to ensure that erroneous data or one-off situations don’t ruin your models.
Always check to ensure (with cross-validation) that removing these outliers creates better models than leaving them in.
Other Articles in our Data Mining Series
Here at EML, we have full series breaking down those tough-to-learn topics in data mining.
You can find the rest of that series here:
- Bayes Classification In Data Mining: A complete introduction to Bayes Classification, with full python code (like all articles in this series)
- Correlation Analysis In Data Mining: Like this topic, there are some things you need to do before you can call your data set ready to model. A full correlation analysis is one of them
- Summarization in Data Mining: Summarization is tough and even tougher in data mining. Here we have a full guide implemented with python
- Major Issues in Data Mining: Sometimes, it’s not all rainbows and sunshine. There are some major issues in data mining. This article gives a full breakdown of each, completely addressing the top 20.
Frequently Asked Questions
What is the difference between outliers analysis and anomaly detection?
The main difference between outlier analysis and anomaly detection is the given set of data you’re working with and the business problem context. If your problem is focused on “rare” events, like fraud or things breaking, you’re solving an anomaly detection problem.
Should You Always Perform Outlier Detection in Data Analysis?
Outlier detection should always be performed in data analytics, but whether you remove data points or not should come down to your modeling goals and metric increase during cross-validation. Outliers may help accuracy and other metrics in proximity-based methods; if so, they should be kept to identify similar data points.
Is Outlier Detection Only For Target Variables Or All Features?
Outlier detection methods in data mining and data science should be performed on all variables. Your goal is to identify outliers or collective outliers, things that can possibly skew distributions within either the target or non-target data set.
Is My Model Bad If I didn’t Perform Outlier Detection Techniques?
Your model is not bad if you didn’t perform outlier detection techniques. One of my favorite techniques is to go back and test if removing newly detected outliers even increases the KPI metric that I’m using. If it does, I incorporate this technique into modeling; if not, I continue with the old model that still has outliers.
What are some common challenges of outlier detection?
Some common challenges of outlier detection are understanding the types of outliers you are dealing with and how they relate to your business problem. Many mistakenly remove outliers in anomaly detection problems simply because they do not understand the relationship between these points and their business problem.
